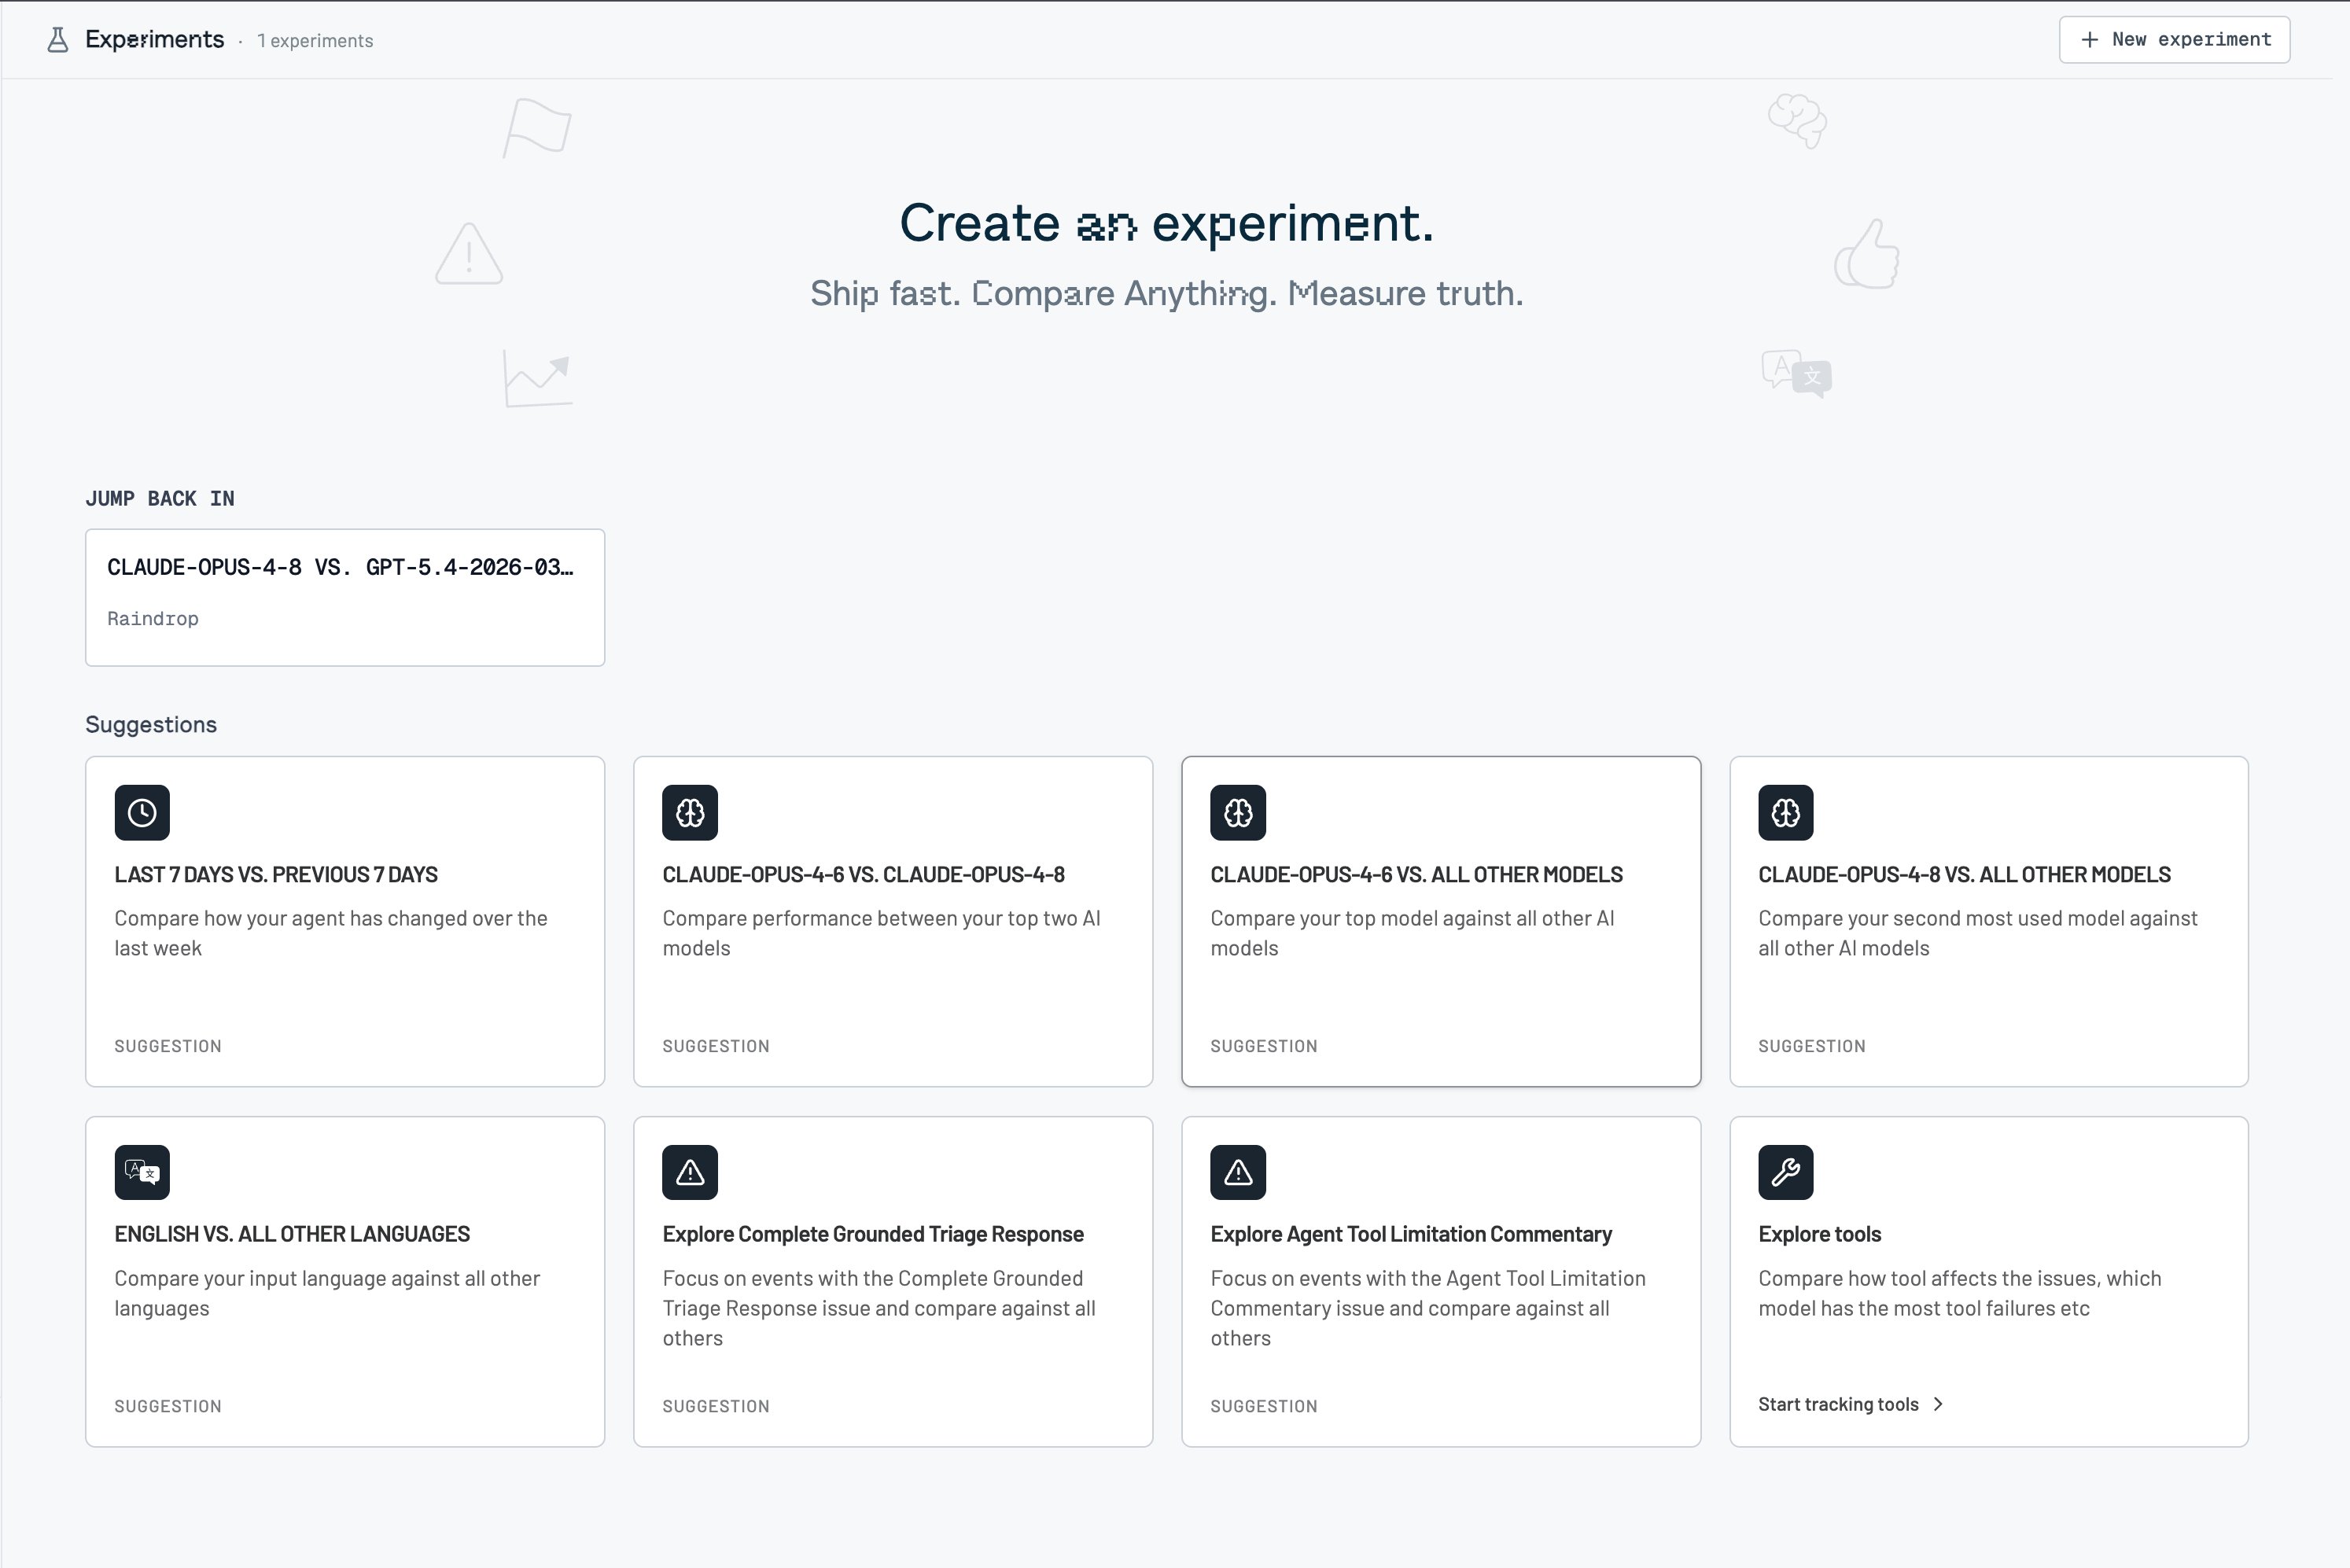
An experiment compares two groups of logged events: a Baseline and an Experiment. Use it to compare date ranges, models, prompt versions, or feature flag variants. Experiments read existing traffic; they don’t run or replay your agent.
The Experiments home with suggested comparisons

Roles and permissions

  • Creating and editing experiments requires Pro. See Plans and limits.
  • Each experiment belongs to one project. Choose a project when creating from All projects.

Using experiments

Create a comparison

Open a suggestion or click New experiment.
  1. Set the Baseline and Experiment date ranges.
  2. Add conditions that define each cohort, such as model, feature flag, property, or tool.
  3. Under Results, choose All signals or select the signals that define success.
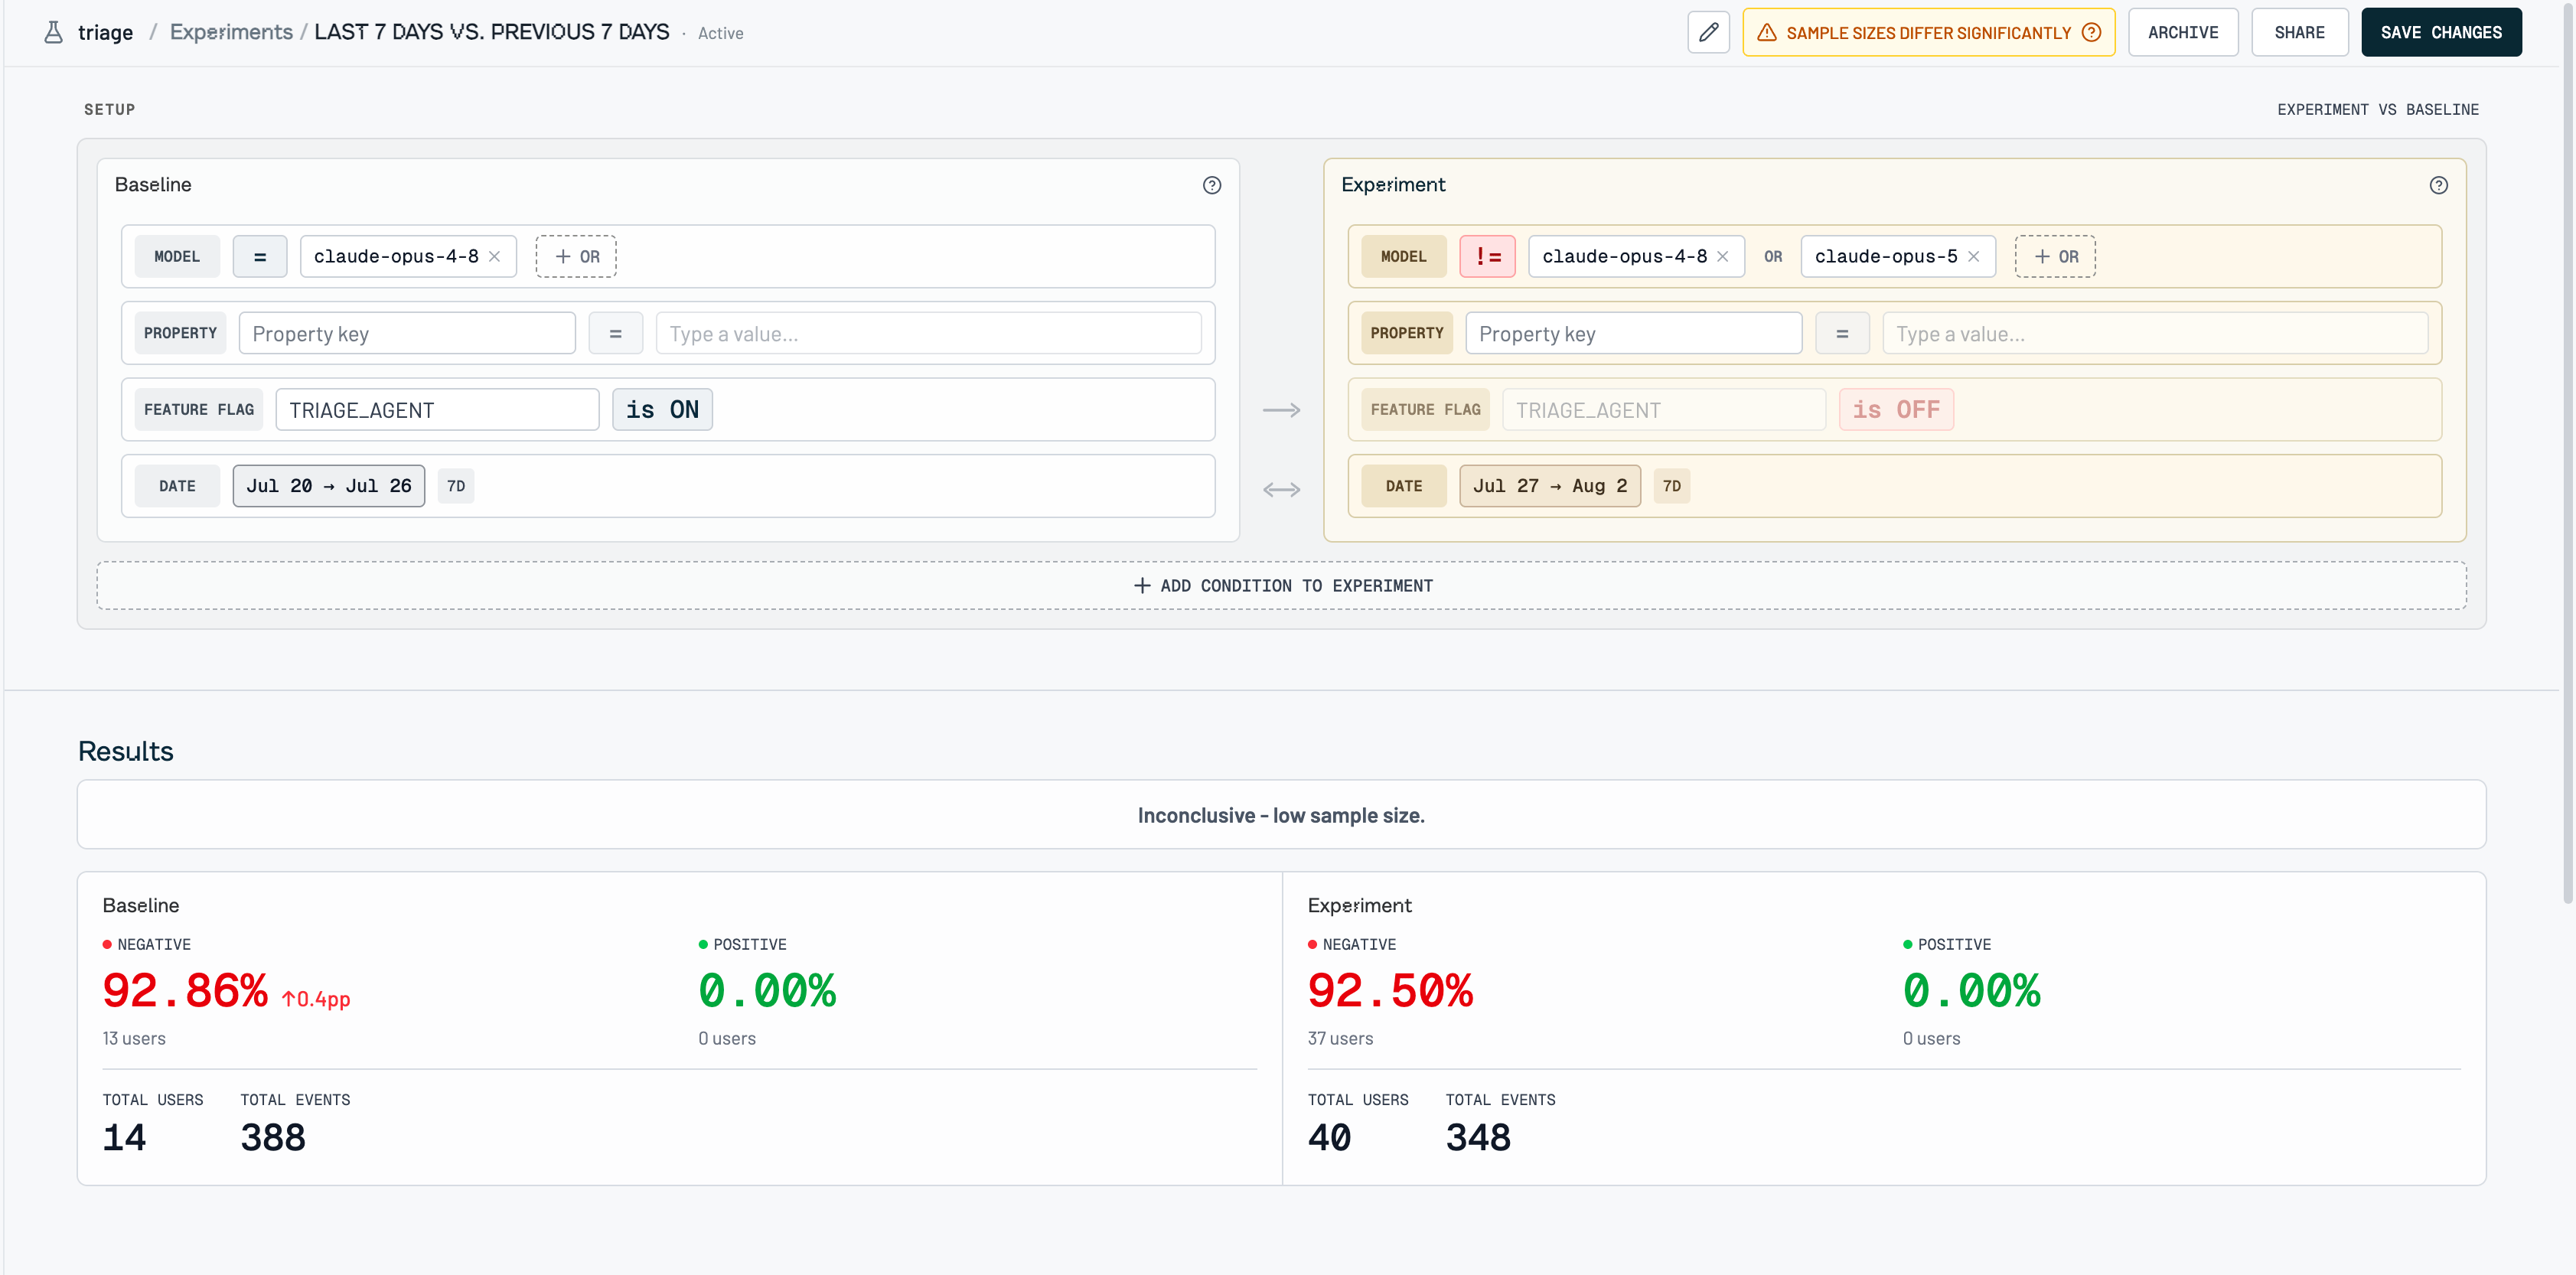
Keep outcome signals separate from cohort filters. For example, compare a feature flag’s variants, then select Task Failure as the outcome to measure. Events % is the default. Switch to Users % to measure the share of users with matching signals. Lower rates of negative signals and higher rates of positive signals count as better.
Configuring the Baseline and Experiment sides

Ask Raindrop

Ask Triage in the app or Slack to read a saved experiment, preview a comparison, or save a new one:
  • “Show the results for our Checkout rollout experiment.”
  • “Compare checkout-v2 on versus off over the last seven days, using Task Failure as the outcome.”
  • “Save that comparison as Checkout rollout.”
Open a preview’s link to edit its prefilled cohorts and outcome rule. Saving creates a named experiment. You can also create and read experiments through MCP.

Read the results

Results shows each cohort’s signal rates and the change in percentage points. Hover the blue interval bar for its range and measured change; the info icon shows the 95% confidence interval and p-value. A likely better or likely worse result requires an interval that excludes zero and passes the sample check in the selected unit. Mixed means one outcome improves significantly while the other worsens. The page, Triage, and MCP use the same rule and verdict. The comparisons below show individual signals, event statistics, and other breakdowns.
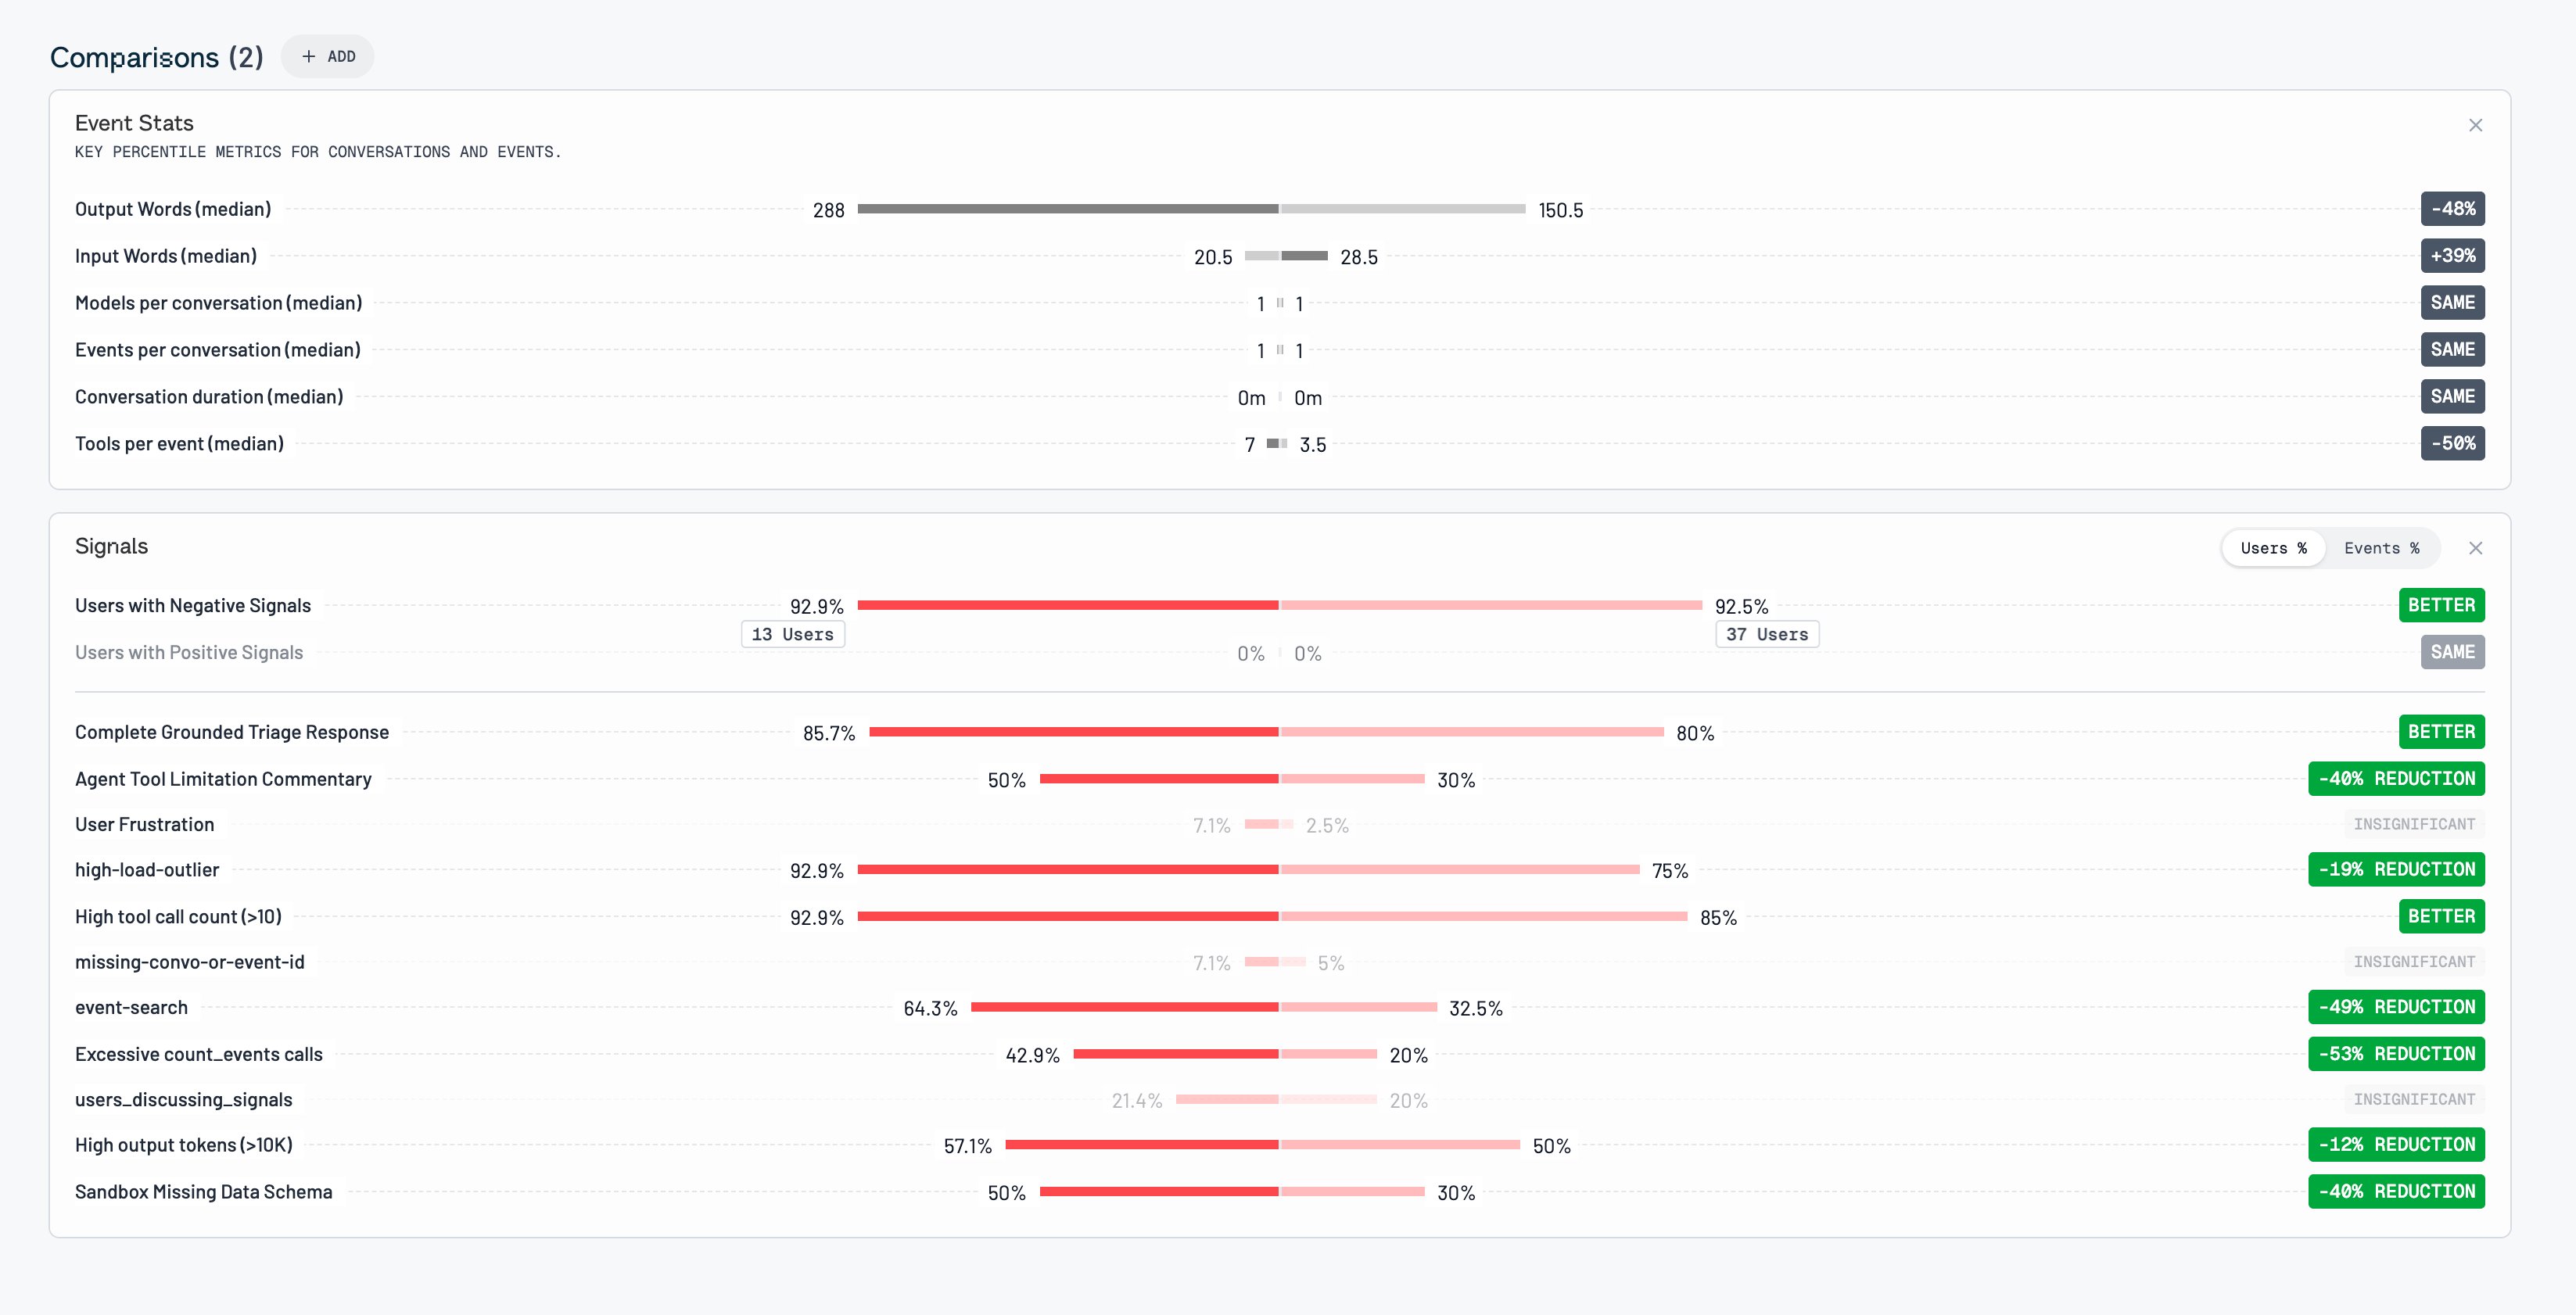
Comparison modules with a signal-by-signal breakdown

Inspect matching events

Click a signal, model, language, or property row to open the events table. Switch between Baseline and Experiment, then click an event to open the conversation sidebar. The table includes model, tools, duration, errors, and signals.

Save and share

Click Save experiment and give it a name. After that, changes to cohort filters, selected signals, units, and comparison modules save automatically. Check for Saved in the header. Use Share to copy its link, or Archive when it’s no longer needed. Archived experiments can be restored.

Troubleshooting

Not enough data or an inconclusive result. Check for empty, small, or uneven cohorts. An interval crossing zero means the data doesn’t show a clear difference. Verdict unavailable. Check that your selected signals can be evaluated and that the cohorts aren’t filtered by signals or issues. Changes aren’t saving. Click Save failed · Retry in the header.