Raindrop Workshop is the open-source local debugger your agent is missing. It runs on your machine, mirrors traces from your agent locally, and gives your coding agent the context it needs to understand failures, write evals, and fix the code that caused them.Documentation Index
Fetch the complete documentation index at: https://raindrop.ai/docs/llms.txt
Use this file to discover all available pages before exploring further.
Install
Instrument your agent
Open Claude Code, Codex, Cursor, or another coding agent in your project and run:What you get
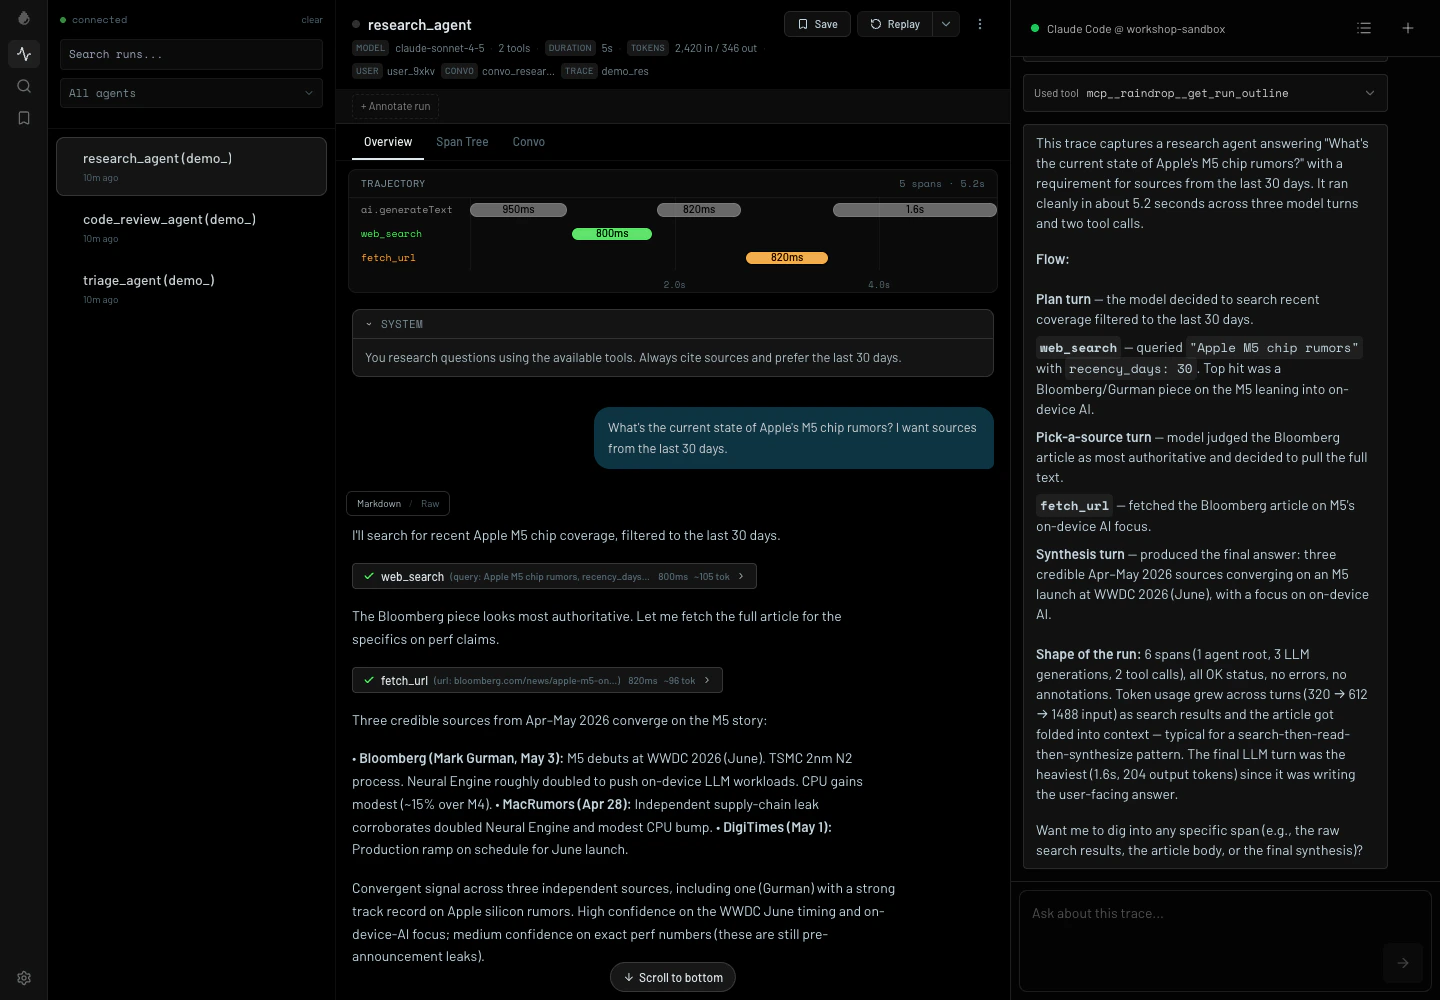
Live streamed traces
Watch tool calls, timing, inputs, outputs, and errors stream in while your agent runs.
Coding-agent context
Ask your local coding agent what happened in a trace and let it inspect the run directly from Workshop.
Eval loop
Turn failures into tests, patch the agent, and verify behavior without losing the trace context.
Replay against local code
Rerun a trace to help you ship with confidence.
Ask what happened
Workshop ships with the tools your coding agent needs to inspect traces, find failures, and run replays — no additional setup. Open the chat pane and ask:Replay locally
Workshop can also help you test your changes. Rerun your agent with an adjusted system prompt, tool definitions, or a new model. Set it up from your coding agent:- replace the last user message and rerun the trace
- try a different model or system prompt
- verify that a code or prompt patch changes the resulting trajectory
- compare the original trace to the replayed local run
The workflow
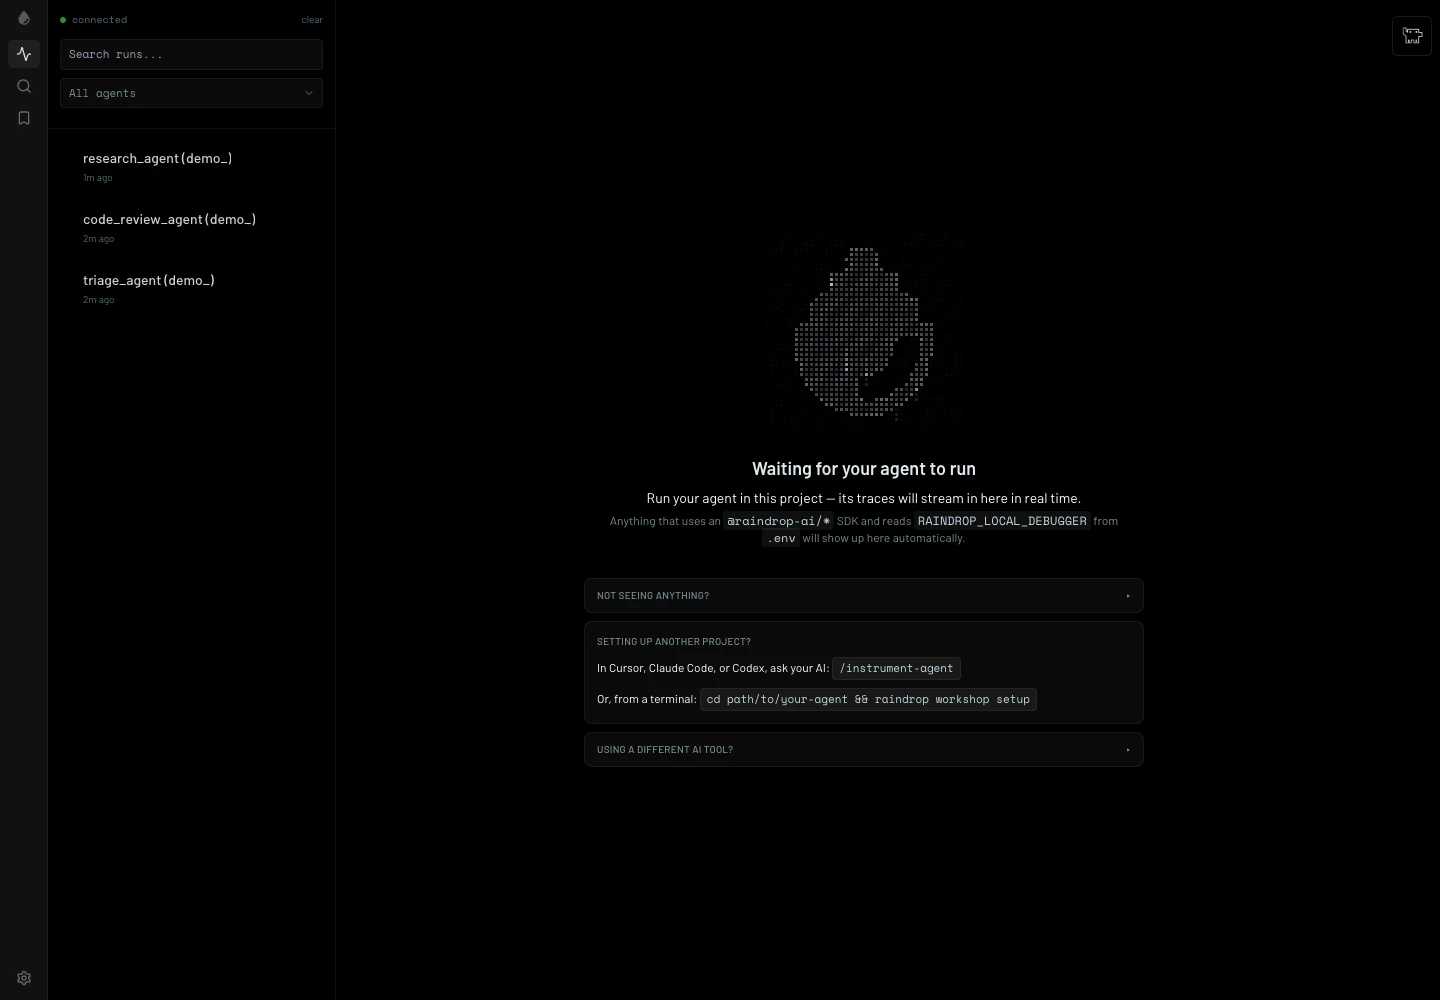
Instrument your agent
Run your agent
Any Raindrop SDK in your project that sees
RAINDROP_LOCAL_DEBUGGER mirrors traces to Workshop while still using your normal code path.Inspect what happened
Open a run to see the timeline, model calls, tool calls, payloads, timing, and errors.
Hand it to your coding agent
Ask your local agent to inspect the active Workshop trace, explain what happened, and help patch the code.
Local trace view
Compatible with your stack
- Languages: TypeScript, Python, Go, Rust
- SDKs and frameworks: Vercel AI SDK, OpenAI Agents SDK, Anthropic SDK, Claude Agent SDK, LangChain, LangGraph, CrewAI, Mastra, Pydantic AI, DSPy, Google ADK, Strands, Agno, Deep Agents
- Providers: AWS Bedrock, Azure OpenAI, Vertex AI
- Coding agents: Claude Code, Codex, Devin, Cursor, OpenCode
- Transport: Raindrop SDKs or OTLP JSON at
/v1/traces
Useful commands
Next
Raindrop MCP
Connect your editor to production Raindrop data and the Triage agent.
TypeScript SDK
Instrument a TypeScript or Node.js agent so local traces show up in Workshop.