

How it works
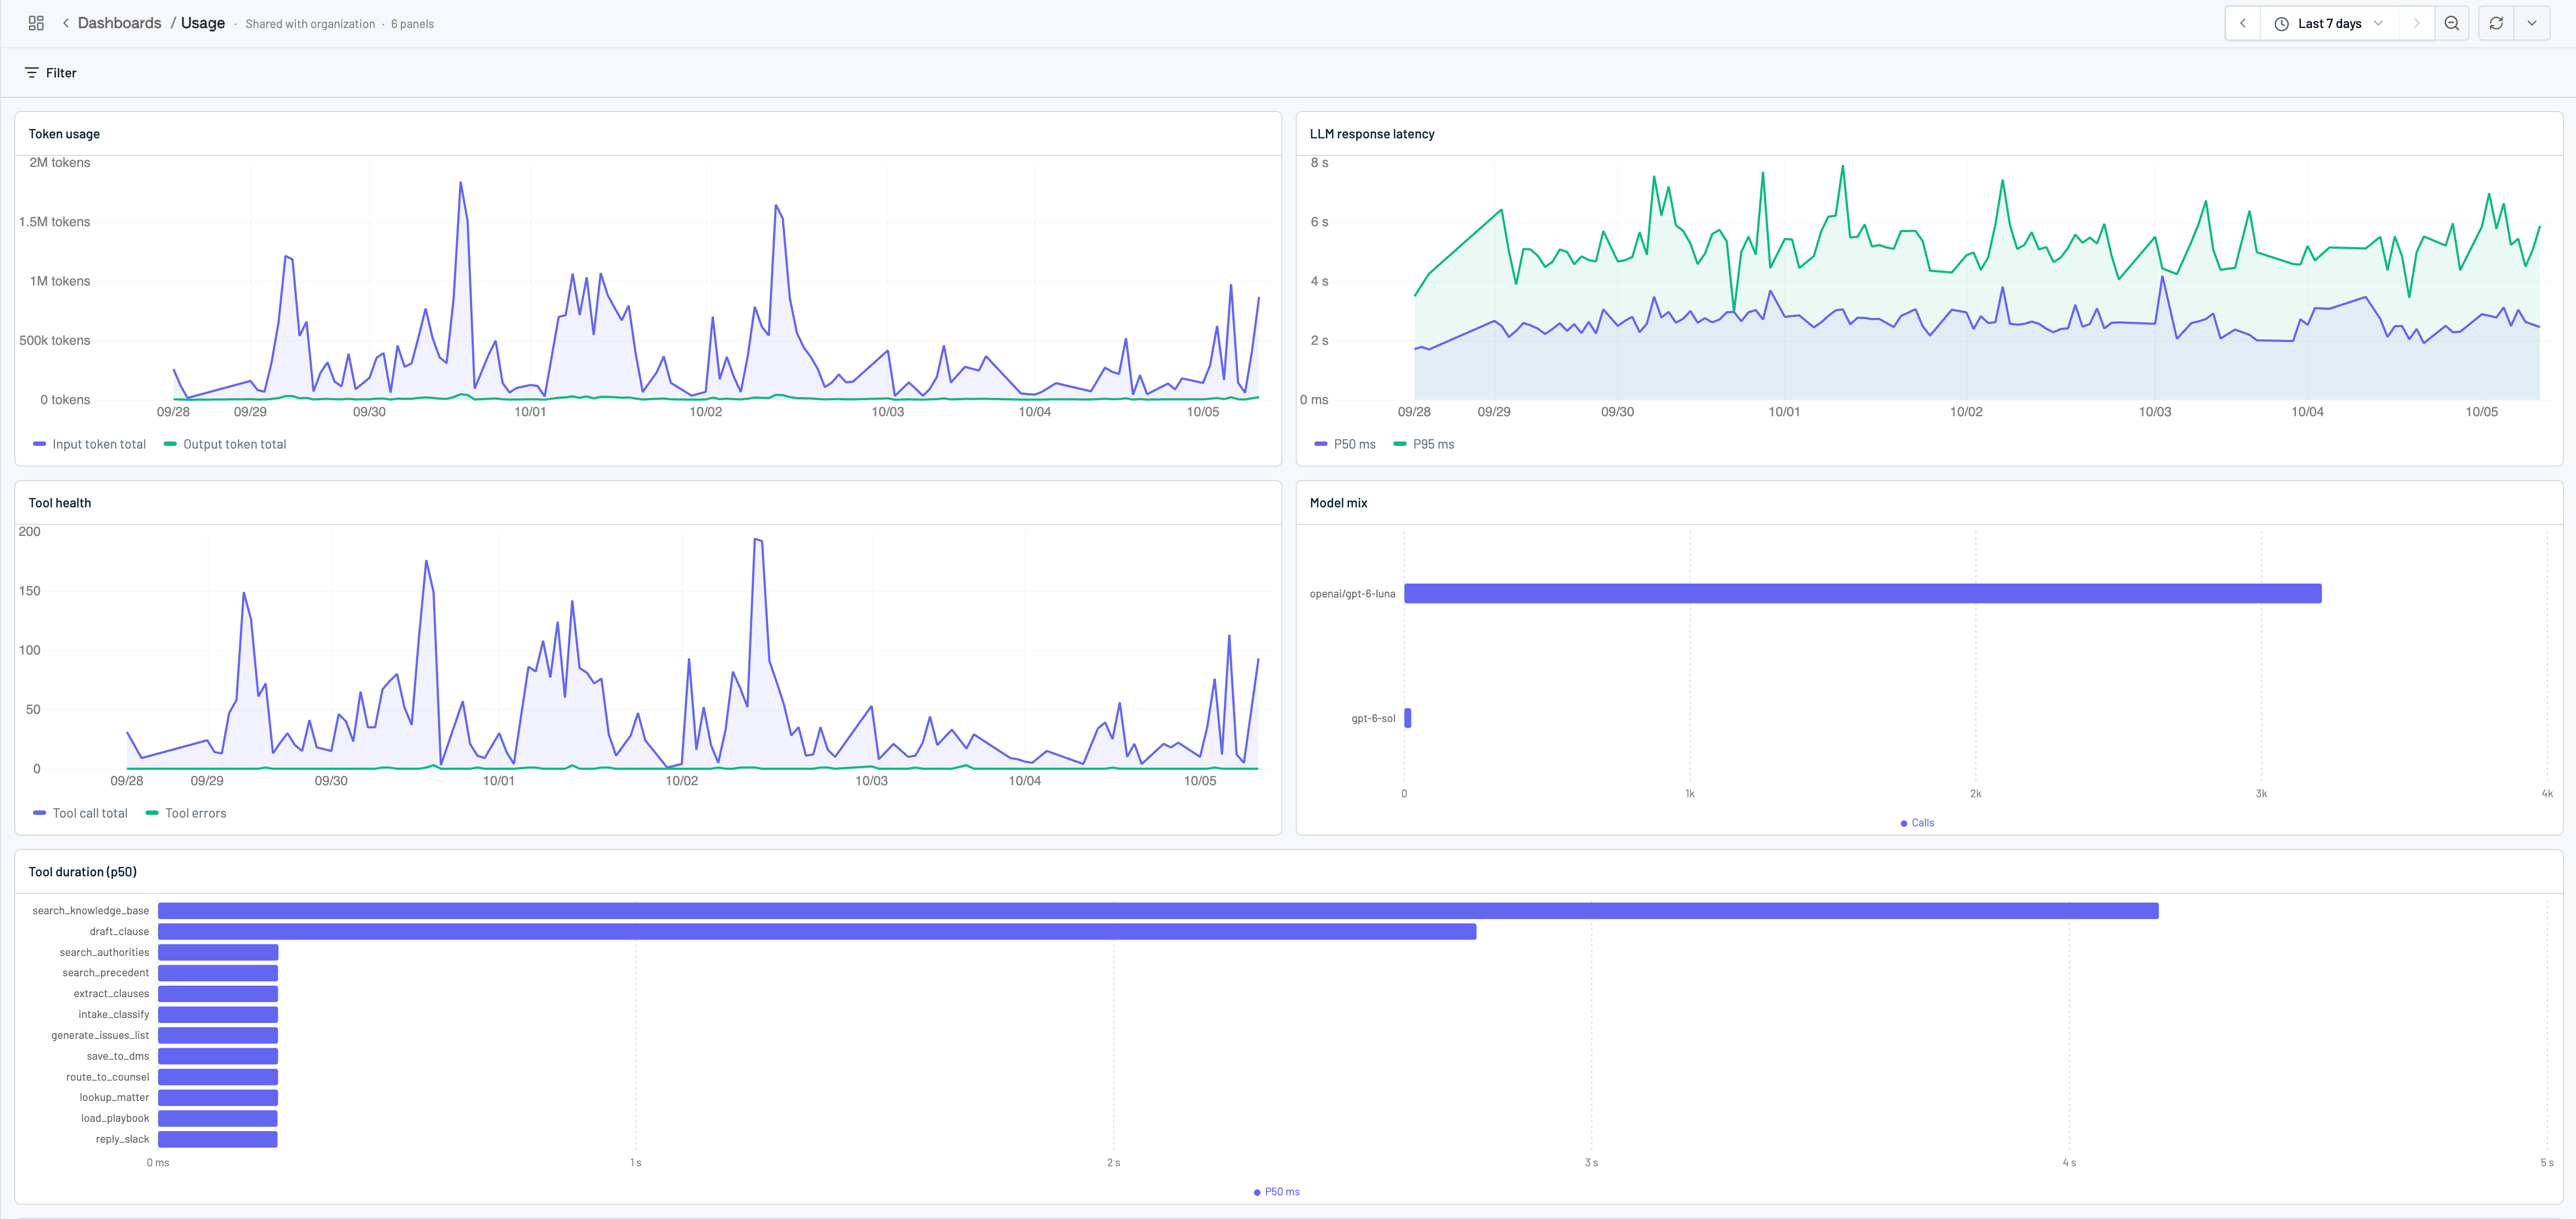
Every project gets a built-in Usage dashboard once it has events with token usage or tool calls in the last seven days: time to first token, token usage, LLM response latency, tool health, model mix, tool duration (p50), and cache hit rate. You can’t edit the Usage board, but you can build any number of your own. A custom dashboard holds up to 24 panels. Each panel is either a query panel (an RQL query plus a visualization) or a text panel (notes for whoever is reading). The dashboard owns the time range (last hour through last 30 days) and injects it into panels that queryevents or traces; a panel can override it, and users / conversations panels aren’t time-windowed. Dashboard-wide filters (model, tool, user, property, and so on) apply to events panels directly and to traces panels through the events that own the spans; a filter a panel’s table can’t express is skipped for that panel.
Panels support stat, time series, bar, pie, gauge, histogram, scatter, heatmap, state timeline, table, and events-list visualizations, with unit formatting for percentages, durations, and tokens.
Roles and permissions
- Dashboards are available on every plan.
- A dashboard is either private (visible and editable only by you) or shared with the organization (anyone in the org can view and edit it). Dashboards created through Triage or MCP are shared.
- Each dashboard belongs to one project; the built-in Usage board follows whichever project you have selected.
Using dashboards
Create a dashboard on the Dashboards page
Open Dashboards and click New dashboard. The dialog asks for two things: a Title, and What should this dashboard show?, where you describe the panels you want (“daily event volume and error rate over the last 7 days”). Leave Share with organization on to share the dashboard with your team, or turn it off to keep it private. Click Build dashboard: the editor opens with Triage beside it, and Triage writes an RQL query for each panel, checks it against your data, and adds the panels. Click Create blank instead to start from an empty board. To change the board later, describe the change in the ask bar at the bottom of the editor and Triage edits the panels. To build a panel yourself, click + (Add panel) in the header, write the RQL, pick a visualization, and set units; the editor runs the query as you go.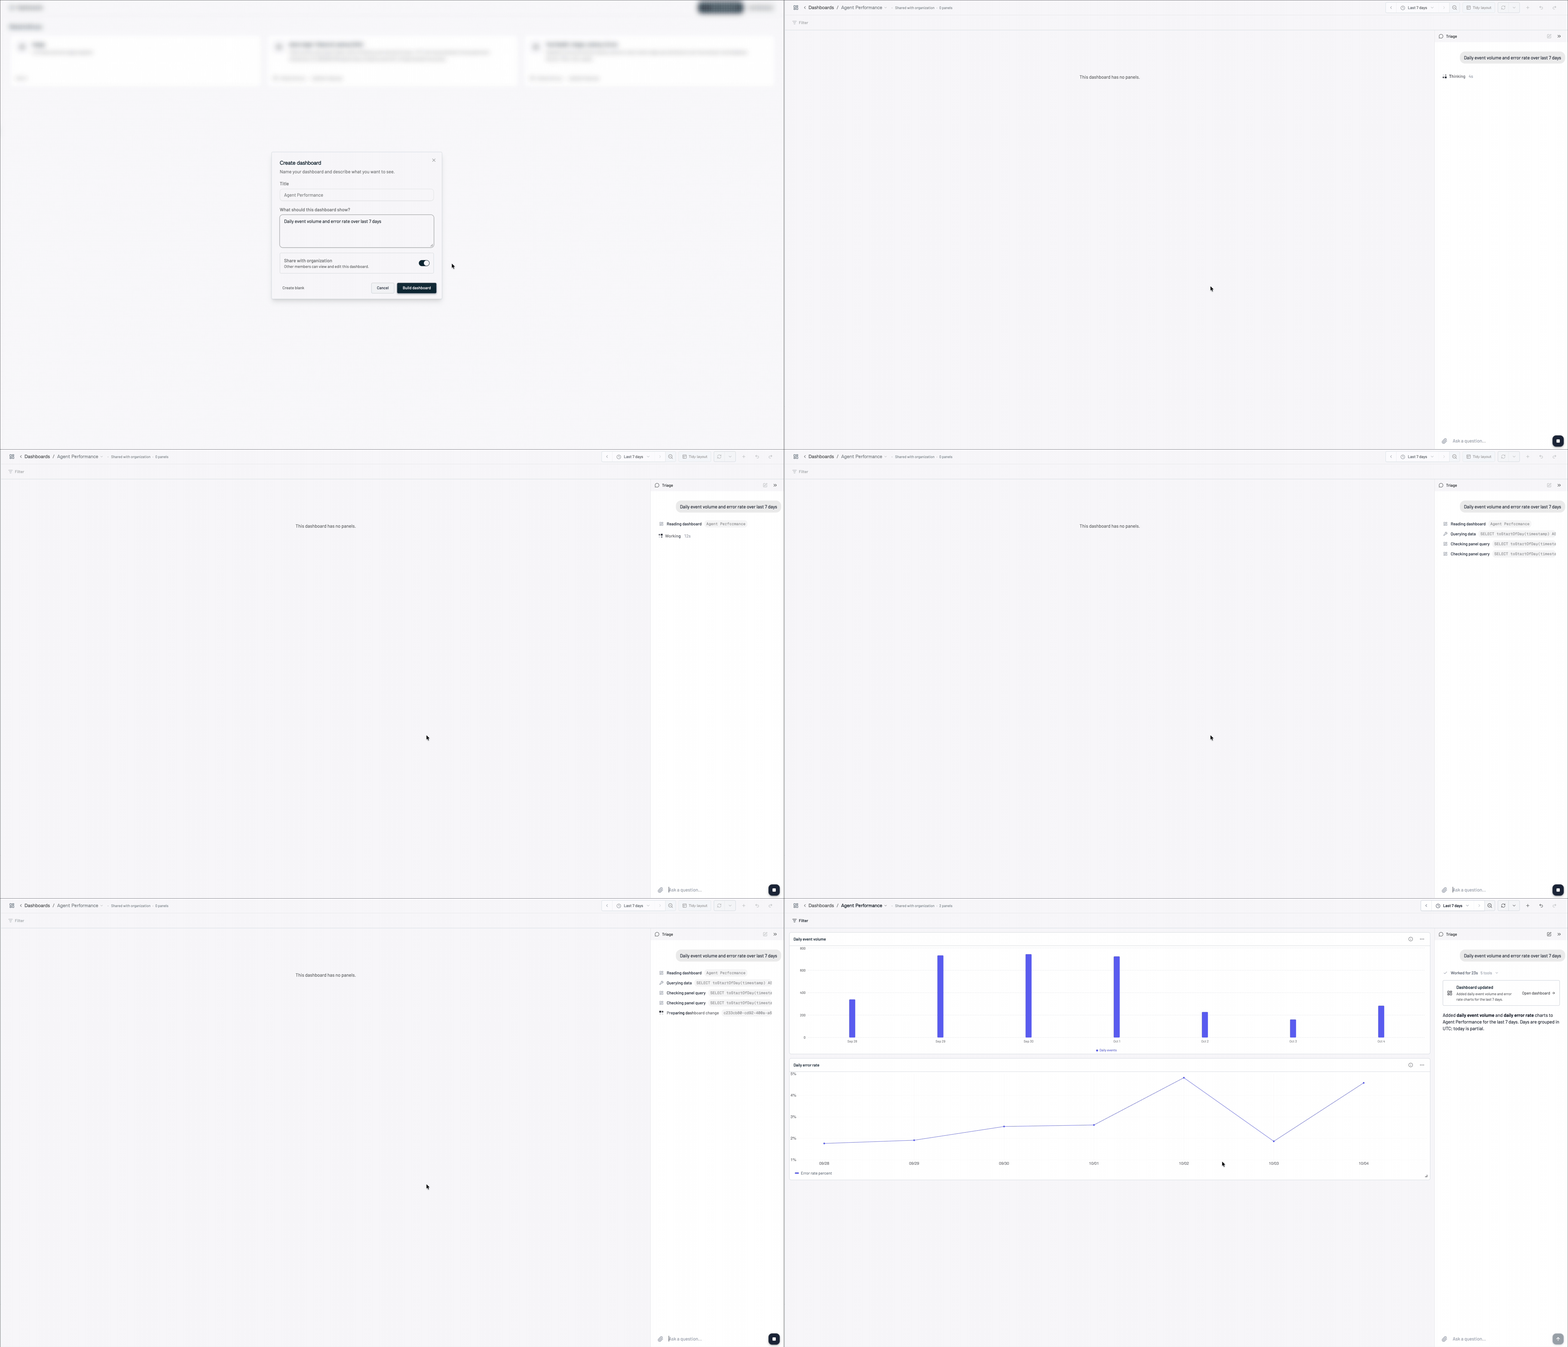
Create a dashboard from Triage
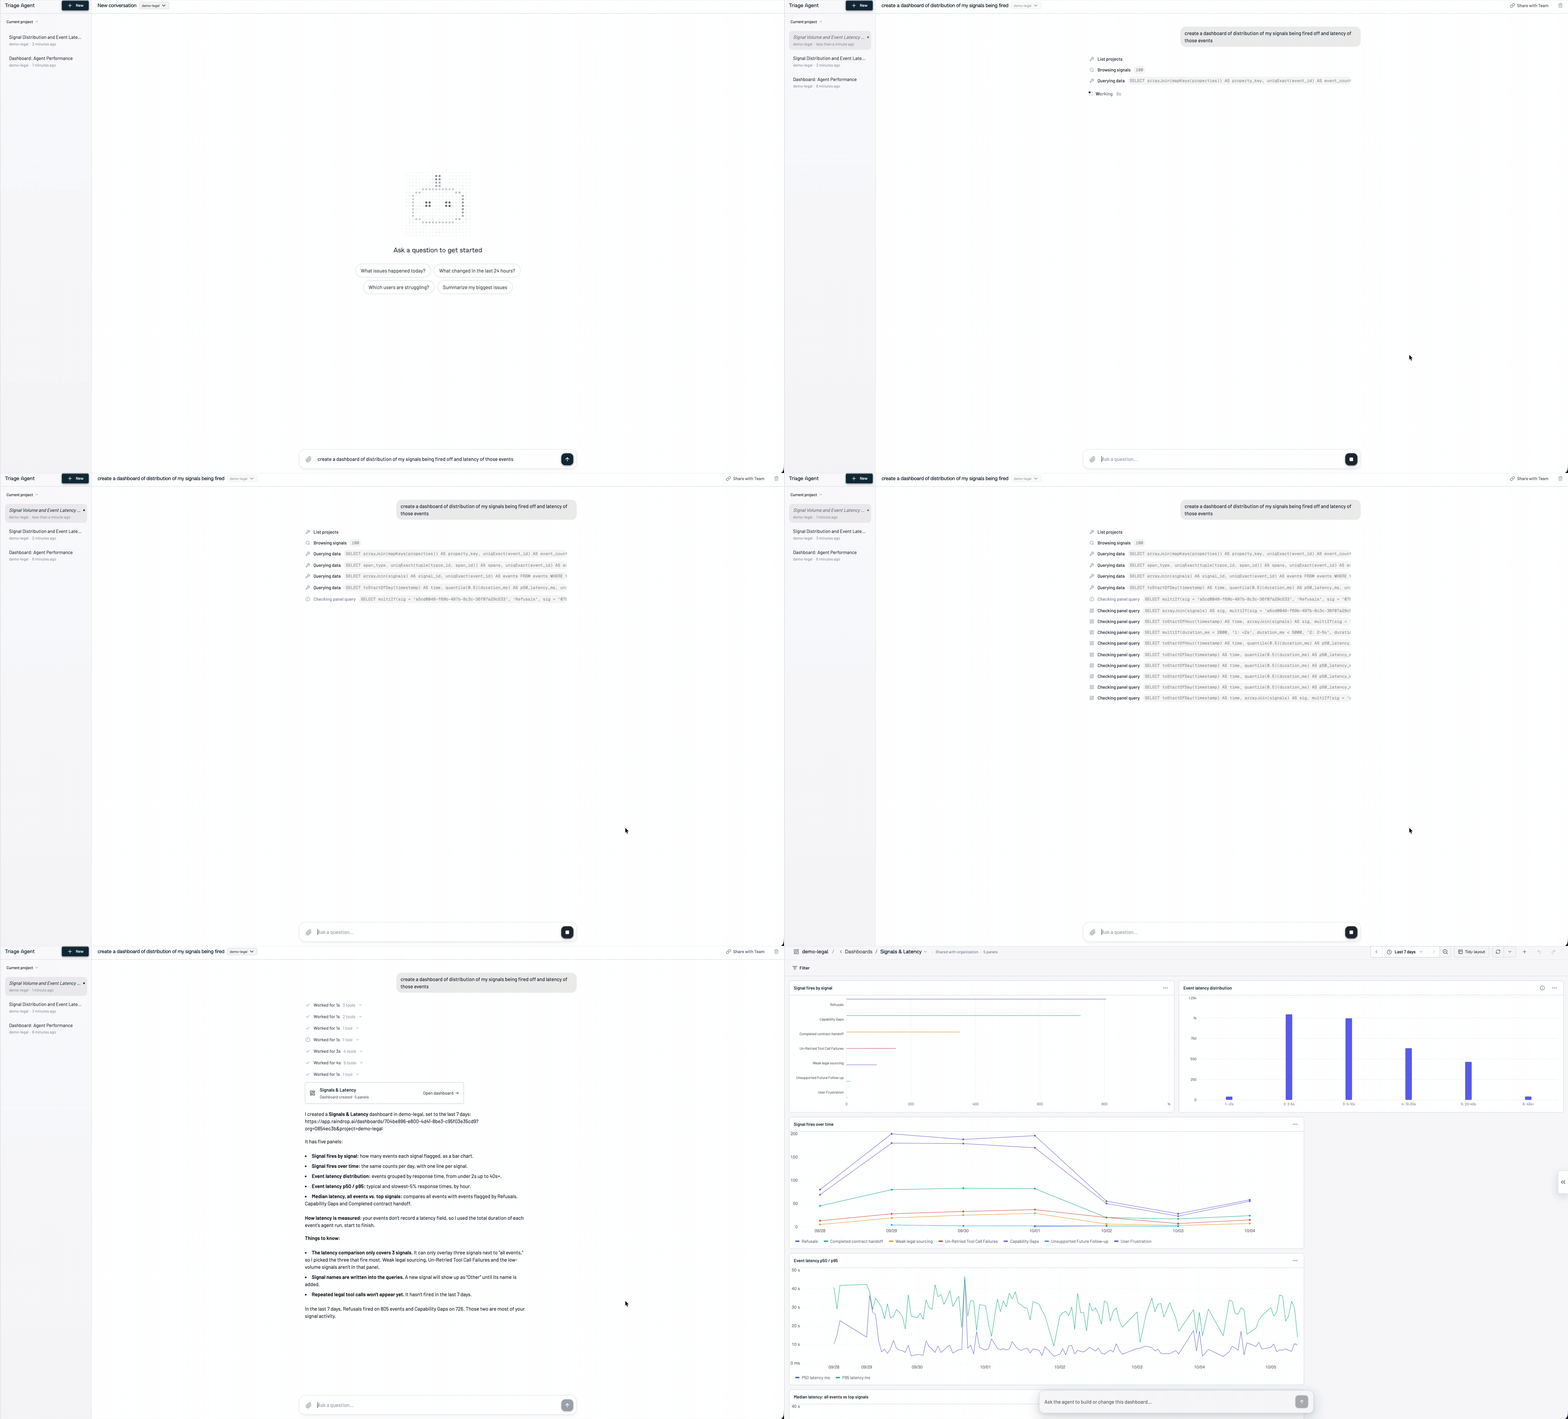
Ask Triage in the app or in Slack to build one and it saves the dashboard for you, then links to it:- “Build me a dashboard of tool error rate by tool and p90 latency by model for the last 7 days.”
- “Add a panel to the Support dashboard showing refusals per day.”
- “Change the Support dashboard to only include the
support-chatevent.”
Drill into a panel
On bar charts and tables whose query reads fromevents or traces, click a bar or row to open the matching events, with the panel’s query and the dashboard’s filters and time range already applied. From there you can open any conversation and read the trace behind the number.
Dashboards from your coding agent (MCP)
The MCP server exposes the same dashboards to Claude Code, Cursor, Codex, and other agents: list and read dashboards, preview a panel query, and create or edit dashboards directly. See Build dashboards directly and the RQL guide for the query language.Troubleshooting
A panel is empty. Widen the time range first; then check that the dashboard filters aren’t excluding everything. Open the panel to run its query and read the result shape. I can’t see a dashboard a teammate made. It’s private to them. Ask them to open it and choose Share with organization. My query errors ontimestamp. Saved panel queries don’t filter on timestamp or end_timestamp themselves; the dashboard injects its live range. Remove the time predicate and use the time range picker instead.
Related
- RQL and the RQL reference
- Events
- Cost Tracking
- Experiments for before/after comparisons instead of live monitoring
- Triage Agent